Imagine drawing a hill. Instead of a 3D map, you make an image using different closed lines. Each line represents a height above sea level. That is exactly what contour lines are.
Contour mapping in construction involves creating a detailed shape and height of the land using topography elements. Imaginary lines are drawn that offer valuable information regarding the crucial features of a site. This helps in planning construction foundation, site work, managing drainage, and connecting roads and utilities.
This guide provides a clear understanding of contour mapping in construction, types, and key benefits.
Based on your list of internal blogs, the most relevant link for a paragraph about contour lines and site preparation is the Grading in Construction.
What Are Contours?
Contour lines are imaginary lines on the map. They show land shape, height, and other features.
Topographic maps use contour lines. Contour lines connect various points on the ground that are at the same height. These points are connected to form a closed line called contour lines. The height is relatively measured, usually against sea-level or a nearby reference point.
Contours help you understand:
- How steep or gentle a slope is
- The heights of hills and mountains.
- The intensity of depressions and valleys.
- The Structure of Landform
What Is a Contour Map?
A contour map is a map that uses contour lines. It shows terrain relief and elevation of the land. Contour maps don’t use shading or 3D models. Instead, they use lines that are arranged at regular intervals in the vertical direction. All the lines together indicate the difference in height across the land.
Contours, in contrast to simple location maps, provide vertical information like the slope and height of the land. This is essential in engineering and construction planning.
A contour map enables the professionals to:
- Measure slope gradients
- Identify drainage patterns
- Locate high and low points
- Estimate earthwork volumes
- Plan infrastructure safely
Understanding Contour Lines and Contour Intervals
Reading contour mapping is necessary to know the site terrain. Whether you are working in surveying, civil engineering, environmental planning, or construction, understanding how to predict the patterns of elevation can save you a lot of money and help you make better decisions. It can increase your work efficiency by 60%.
Contour Intervals
Contour intervals are the distance between the two consecutive contour lines. It stays constant throughout the map.
Features of Contour Lines
- All contour lines depict one elevation value. Contour lines cannot cross each other because two points of land can not exist at different levels.
- Contour lines create closed shapes, which are not always within the borders of a map.
- Standard units such as feet (ft), meters (m), or millimeters (mm) are used to represent the height of a region above the mean sea level (or also above some reference).
- The hills are depicted by circular closed paths, but with increasing values towards the middle.
- Closed circular lines represent depressions. The size of these lines decreases towards the center due to the small shape of the land.
Types of Contour Lines
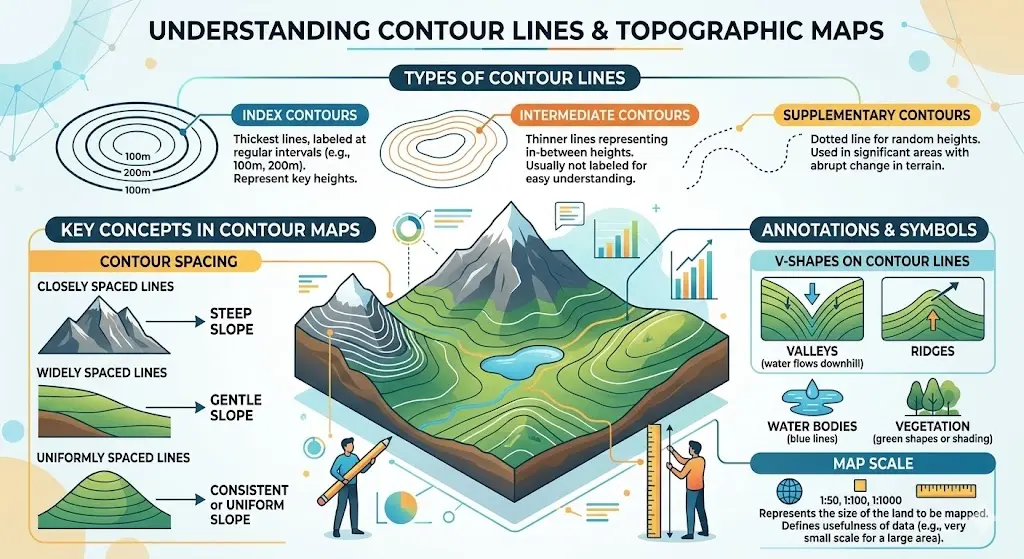
Index Contours: Index Contours are the lines depicted as thickest in maps. They represent height at several points of a map. These are closed circles, usually drawn at a height of 100m, 200m, 300m, and so on.
Intermediate Contours: Represent the heights that fall in-between the index values. For example, lines between index contours of 100m and 200m. The Intermediate contours are lines in between with a size of 120m or 150m. These lines are not labeled with the size, but still exist for easy understanding.
Supplementary Contours: This is a dotted line that shows the random heights in significant areas. They are adopted in cases of abrupt change in the terrain.
Other than these, some of the key terms to be considered during the reading of a contour line topographic map include:
Contour Spacing: This is the horizontal distance between two consecutive contour lines. It describes the steepness or gentle slopes. For example, narrow lines on a contour mean a steep slope, and wide lines show a flat slope. At the same time, uniform lines denote slopes that are even.
Closely spaced lines → Steep slope
Widely spaced lines → Gentle slope
Uniformly spaced lines → Consistent or uniform slope
Annotations and Symbols: V-shapes on contour lines are used to represent valleys and ridges, respectively, with higher elevation lines having the shape facing downhill and lower elevation lines facing upward. Other typical symbols of contour maps are blue lines of water bodies and green shapes or shading of vegetation.
Map Scale: This is a result of the size of the land to be mapped (1:50, 1:100, 1:000, etc.). Making a very small scale of the small land area, such as 1:1000, may imply that the map may not offer very useful data.
Read more about how these technical elements fit into your professional construction drawings.
How to Read a Contour Line Map Like a Professional
You can read a contour map like a professional if you follow these simple steps. To learn how to read contour maps correctly, one must practice and learn by pattern.
Step 1: Identify the contour interval
The distance between contour lines follows the same height. You need to follow the lines to find the height of the land.
Step 2: Find Intermediary contours
Between the contour index, some lines are not assigned any number. For example, the main contour lines are measured in 100m, 120m, and so on. Now, there is a line with a light format. To guess its distance, you need to look at the height of the lines above and below it. In the current scenario, if there is an undefined line in between the contour index, you can estimate the contour intermediary to be 110m.
Step 3: Analyze Spacing
Closely Spaced Lines = steep slope
Widely spaced lines = gentle slope
Extremely close lines = cliff or very steep terrain
Even spacing = uniform slope
Step 4: Compare Landform
| Pattern | Landform |
| Circular lines increasing inward | Hill |
| Circular lines decreasing inward | Depression |
| “V” shapes pointing uphill | Valley |
| “U” shapes pointing downhill | Ridge |
Key Tip: One of the best ways to understand contour maps is to compare them with a real map or photographs.
How Contour Mapping Is Done Today
Contour mapping is a modern method of combining the conventional surveying methodology with the use of advanced digital technology to form precise, scalable, and efficient representations of the terrain. It consists of three key methods, including manual survey, digital mapping, and hybrid methods.
Manual Contour Map Drawing
Surveyors carry out manual contour mapping by using instruments such as a total station and a theodolite. This is used to measure elevation at different intervals. Now the lines are plotted on a piece of grid paper and joined to create contour lines. Although this method is precise in small sites, it is time-consuming and labor-intensive.
Digital Contour Mapping
The digital mapping can be built based on UAVs (drones), LiDAR, photogrammetry, and GPS to gather millions of elevation points. This data is processed using software programs such as GIS, BIM, and AutoCAD Civil 3D. It produces Digital Elevation Models (DEMs) and virtual contour maps. Digital Contour mapping is done within a very short time and with high precision, hence making it suitable for large or complicated sites.
Hybrid Contour Mapping
Hybrid contour mapping includes both manual verification and the use of digital tools. Critical points are gathered on-site by surveyors, and drones or LiDAR gather bulk terrain data. The integrated data is then handled in software to generate the most precise, verified contour maps to be used in engineering, construction, and site planning.
Modern mapping technologies like LiDAR and BIM are often used to identify site constraints before breaking ground on a project. Learn how these digital insights help you estimate construction costs more accurately for complex terrains
Why Contour Lines Matter in Engineering and Construction
Contour lines provide a visual image of the land. This helps construction experts to make informed conclusions about design, planning, and site development.
Knowing the form and steepness of a land using contour maps assists the engineers in avoiding making expensive errors, ensuring structural stability, and improving the efficiency of a project. They find application in the development of cities and roads, drainage systems, and landscaping. Their applications include :
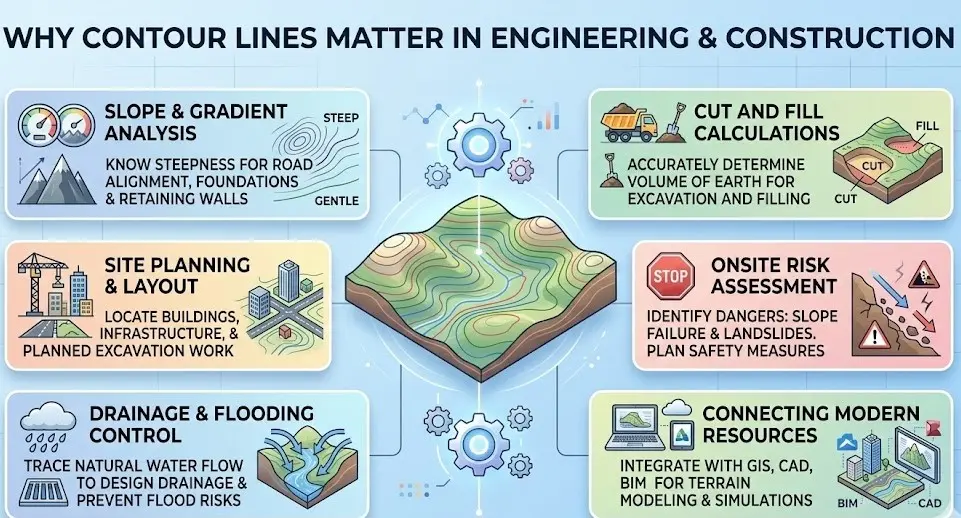
Slope and Gradient Analysis
The contour lines assist the engineers in knowing the steepness of a slope. This data is crucial for aligning roads, building foundations and the design of load-bearing walls of a structure. Lines that are closely spaced represent steep slopes. Other lines, which are far apart, represent a gradually varying slope.
Site Planning and Layout
Knowledge of elevation changes will enable planners to locate buildings, roads, and infrastructure. This allows for well-planned excavation and site-filling work.
Drainage and Flooding Control
Contours are used to illustrate the natural water flow courses. This data allows the engineers to develop effective drainage systems and control flood risks directed at your building.
Cut and Fill Calculations
Contour maps accurately determine the volume of earth that needs to be excavated or filled during the site preparation. It helps in saving time and lowering material expenses with proper planning.
Onsite Risk Assessment
Contour maps allow contractors to assess different risks on site. Construction is planned effectively to avoid slope failure or landslides. Building retaining walls or terraces helps them to avoid slope pressure.
Connecting with Modern Resources
The GIS, CAD, and BIM software can be complemented with contour data, which is why it is now simpler to simulate construction conditions, model the terrain, and optimize the project planning.
Understanding slope and risk assessment is a critical step before breaking ground on any major structural element. This analysis is essential when determining the how much does a foundation cost for your specific site conditions.
Tools Professionals Use for Contour Mapping
Here’s a list of several tools that are used for contour mapping.
| Total Station | Used to measure angles and distances on the ground. The data is entered in the software to draw contour lines |
| GNSS/GPS Receivers | Collect elevation points. It connects with multiple satellites and calculates the position and height of the land. |
| Drone + Photogrammetry | Take multiple land photos. The overlapping images are used to create a 3D model of terrains. |
| ArcGIS | This software uses data from GPS, drones, and total stations to create contour lines. |
| LiDAR Scanners | This tool hits laser pulses to the ground, which in turn hits the sensor. This data is used to calculate the height of the land. |
| MicroStation | Software is used to draft and edit contour lines. |
| AutoCAD / BIM Software | Used to create contour lines automatically from input data. |
Expert Tips for Interpreting Contour Lines Correctly
Correctly determining contour map data means you can make precise site evaluations. This avoids expensive mistakes in the course of construction or land development. Here are some important interpretation factors:
- Make sure to note the contour interval and map scale. The scale and vertical spacing of the map can be used to read slopes and elevation correctly.
- Determine index contours; the broader and labelled lines are simpler to comprehend the general elevation distribution.
- Notice the spacing of the contours. The spacing between lines is very tight in steep slopes, whereas in gentle slopes the spacing is very wide.
- Identify valleys and ridges with V and U-shapes. V-shapes (upstream) point at valleys, and U-shaped (downslope) represent ridges.
- To interpret complicated terrain, sketching cross-sections or mental imagery of the terrain is useful.
- Add other map data, like overlay contours with satellite images, soil maps, or vegetation patterns, to plan better.
Common Mistakes in Contour Mapping
Even experienced professionals can make errors on contour maps. For quality estimates and project management, the following mistakes must be prevented. This increases project accuracy and minimizes risks in a project:
- An error in reading the vertical spacing may lead to an inaccurate estimate of slopes or heights. This can lead to wrongly calculating earthwork and vulnerable structures.
- The natural land is rarely uniform, and irregular spacing is easy to overlook, which can distort the slopes.
- Contour lines do not intersect each other. Lines must not be crossed since one point cannot exist at different heights.
- Excessive lines confuse the map, and fewer lines hide the key features of the terrain. Therefore, adequate lines must be made for easy understanding.
- A V-shape in contour lines defines the streams and valleys. The wrong interpretation of V-shapes may result in mistakes in drainage or flood planning.
- A wrong scale on the map that is either too small or too large can distort elevation information or even miss a significant feature. This can lead to construction mistakes and unwanted expenses.
Avoid costly site errors by mastering accurate terrain analysis—ensure your project starts on solid ground.
Conclusion
Contour lines and contour maps are a crucial part of construction projects. These are imaginary lines that simplify the complex terrain into readable, measurable, and practical information.
Learning to read contours not only enhances technical performance but also increases efficiency, safety, and cost control of the project. It helps in planning sitework, utility installation, foundation, and quality material for structural stability.
Faqs
How do topographic maps differ from contour maps?
Contour maps are a subtype of topographic maps. They show just the elevation of the land, while topographic maps show more features like hills, valleys, buildings, bridges, streams, and more. They also show all the natural and artificial features of a map.
Do contour lines indicate the steep and flat areas of land?
Yes, close spacing of contour lines represents steep slopes. Wide spaces between contour intervals show flat slopes.
What is a contour interval?
The vertical difference in the elevation along the contour lines is known as a contour interval. The smaller intervals give more detail, and the larger areas have steep or large areas simplified.
How does the “V” shape in contour lines help in water flow management?
The contour lines have shapes of V, representing streams and valleys. This shows a point that is facing upstream, facing the source of water, and the open end facing the point of flow. This is useful in flood planning and drainage.
Are digital models important for contour mapping?
Yes, even with 3D digital models or GIS, contour mapping materials are still required in on-site planning, field checking, and visualization of the terrain.