Digital surface model (DSM) is becoming a necessity to ensure the accuracy of construction bids. Unlike a basic map, a DSM captures the topmost reflective surface of the site, including every tree canopy and utility line. By analyzing this 3D data, bidders identify vertical obstacles and hidden costs that traditional flat maps overlook.
In the tough construction world, this 3D map is your best tool. It shows exactly what a bird sees from the sky. This is vital because if you only look at the bare ground, you miss big obstacles. These items need special crews and tools to move, which adds to the price. Using a DSM removes the surprises that lead to costly change orders. It turns a messy plot of land into a clear, quantitative site analysis for a winning, profitable bid.
How We Get High Quality Map Data
To make a good plan for a big project, we cannot use basic satellite maps. We need very clear data that meets high work standards. The way we get this info is by using special tools in the air that map the area in great detail. This data must be so good that it can be used in court if there is an argument about the land. It must be very exact to keep the project safe and on track.
Sharp Data Using Laser Tools
The gold standard for 3D mapping is LiDAR (Light Detection and Ranging). By deploying drones or aircraft equipped with laser sensors, we capture thousands of pulses per second. These beams record the “first return”, the initial contact with objects like tree limbs, power lines, or rooftops. This high-density data provides the precise 3D coordinates needed to build an authoritative Digital Surface Model, ensuring measurements are near-perfect for high-stakes bidding.
Mapping Land with Pictures
Another common way is using drone photos. This tool uses high-quality cameras to take hundreds of photos that overlap. Special computer programs then link these photos into a 3D map. This way is very helpful for watching daily work or measuring stockpiles on a busy site. But, for these maps to be used for a real bid, the pilot must have an FAA Part 107 Commercial Pilot Certification. Without this paper, the data is not legal and could lead to huge fines from the people in charge.
Tuning Data with Ground Marks
No matter which air tool we use, the map must be locked to the real world. We use Ground Control Points or GCPs to do this. These are markers on the ground with set GPS spots that act like anchors for the digital map. In big cities like New York, where tall buildings block GPS signals, we use extra markers to stop errors. This makes sure the heights in our model match the local landmarks. This gives us a solid start for our dirt work math and keeps everything correct.
Learning the Geospatial Layers: DSM vs DTM
To win a bid, you must distinguish between the “bare earth” and the obstacles sitting on top of it. We use a Height Attribution check to quantify clearing costs using the formula:
DSM – DTM = Height of Surface Objects
| Feature | Digital Surface Model (DSM) | Digital Terrain Model (DTM) |
| Primary Inclusion | Everything visible (trees, roofs, structures) | Bare earth (soil and rocks only) |
| Primary Use | Clearing, Grubbing & Obstacle Detection | Grading, Excavation & Foundations |
| Data Source | LiDAR First-Return / Photogrammetry | LiDAR Last-Return / Interpolated Survey |
By subtracting the ground height (DTM) from the surface height (DSM) in CAD or GIS software, we determine the exact volume of vegetation or debris. This turns a “guesstimate” into a precise count of truckloads and labor hours needed for site prep.
Practical Applications of DSM in Modern Construction
The real use of these maps reaches into every part of the planning and building phases. We do not just use them for mapping. We use them to follow the many rules and moves of the U.S. building industry. This data keeps projects on time and keeps the firm out of legal trouble.
Better Cut and Fill Accuracy
The main use of DSM in building is the Cut and Fill check. We compare the current top layer to the heights the architect wants to see how much dirt must be moved. This is very important in states with strict environmental regulations like Title 24, Part 2 (California Building Code) and local San Francisco amendments; the slope of the land must be exact to make sure water flows right, and the ground stays safe during earthquakes. The model lets us plan these slopes with a level of care that old ways of measuring just cannot match in the same amount of time.
Following Federal Rules
We also use surface maps to follow the Section 404 Clean Water Act (CWA). The U.S. Environmental Protection Agency (EPA) and the U.S. Army Corps of Engineers (USACE) need us to find any wetlands or natural water paths. By looking at the site in a sharp 3D view, we can spot low spots that might be protected by law. Finding these early lets us plan for the 6 to 12 month wait times for wetland permits. This keeps a project from stopping halfway through.
Moving Tools and Site Access
A 3D surface map is a key tool for planning how big machines move. If we are bringing in large diggers or cranes, we need to know if there are low wires or tight spots between old buildings. The model lets us test these moves on a computer first. This stops accidents and makes sure we have the right Right of Way (ROW) papers from the city. It also makes sure we follow the FAA Part 107 Regulations if the site is near an airport. It turns the plan for moving tools from a guess into a real plan.
Showing Work and Progress
Past the first price, we use the map to show work updates to the owners. Instead of a list of numbers, we can show a 3D color map of the work done. This visual proof is strong for getting paid and showing that the job meets the high standards set by the AIA G201™–2013 for sharing digital data. It builds trust and makes sure that every person is looking at the same set of facts.
Deep Look at Map Data and Points
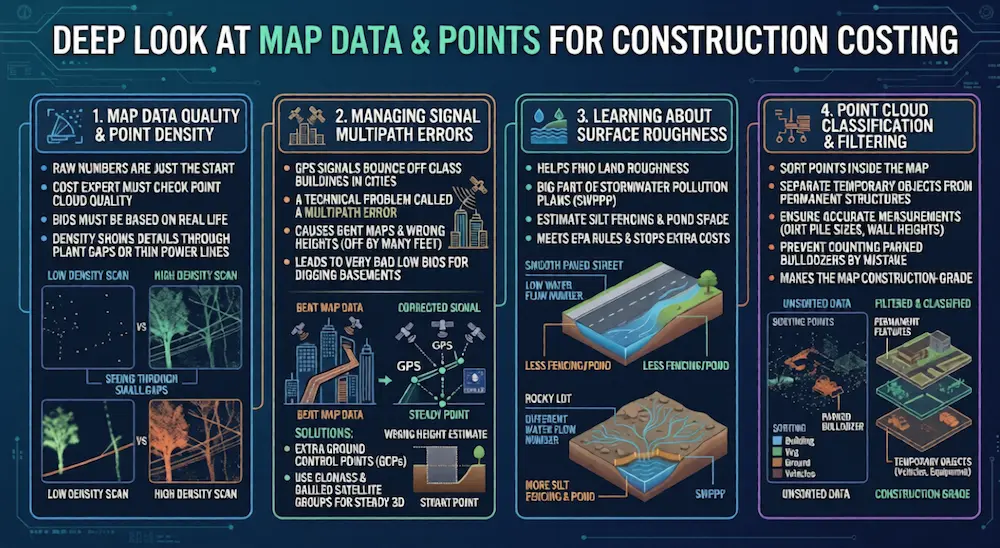
When working with top-level map data, the raw numbers are just the start. A pro cost expert must look at the quality of the point cloud to make sure the bid is based on real life. The density of these points shows how well we can see through small gaps in plants or find thin power lines that might be missed by low-quality scans.
Managing Signal Multipath Errors
In crowded city spots, GPS signals can bounce off tall glass buildings before hitting the tool. This is a technical problem called a multipath error. When making a map for a job in a place like downtown San Francisco, we fix this by using extra Ground Control Points. We also use GLONASS and Galileo satellite groups to make sure our 3D spots are steady. If the map is a bit bent due to signal bounce, your height numbers could be off by many feet. This leads to a very bad, low bid for digging out a basement.
Learning about Surface Roughness
Surface data also helps us find the roughness of the land. This is a big part of Stormwater Pollution Prevention Plans (SWPPP). A smooth, paved street has a different water flow number than a rocky lot. By looking at the feel of the point cloud, we can guess exactly how much silt fencing and pond space is needed to meet EPA rules. This stops the extra costs that often make bids lose.
Point Cloud Classification and Filtering
New software lets us sort the points inside the map. We can separate points like temporary building tools or cars from things that stay. This makes sure that when we find the size of a dirt pile or the height of a wall, we are not counting a parked bulldozer by mistake. This level of technical sorting is what makes the map construction-grade rather than just a simple picture.
Strategic Applications of Surface Modeling Across Industries
While we focus on the building site, the use of high-quality surface maps reaches into many other work areas. These uses often mix with our work, especially when dealing with power lines, phone towers, and big nature plans. Knowing these wider uses helps us work well with experts on large projects.
Telecommunications and 5G Expansion
The 5G rollout across the United States depends a lot on 3D surface data. Because 5G signals are easily blocked by buildings and leaves, experts use these maps to do a Viewshed Analysis. They need to know exactly where the obstacles are to place towers for a clear line of sight. When we build near these towers, our surface maps help make sure our buildings do not get in the way of the area’s phone networks.
Stormwater and Flood Modeling
Water experts use surface maps to guess how water will act during bad weather. By mapping the heights of every curb, wall, and driveway, they can test flood paths with great care. This is a main part of making a Stormwater Pollution Prevention Plan (SWPPP). In areas near the ocean, this data is used to bid on shore safety jobs. It makes sure that sea walls are high enough to handle big waves.
Agriculture and Forestry Management
In the Midwest, farmers use surface maps to stop soil loss and water runoff. By knowing the small shapes of their fields, they can build better water systems. In the same way, the forest industry uses this tech to find the total volume of the tree tops. This lets them guess how much wood they have without sending a team into the woods to measure every tree. For a building bidder, this same data helps us find the value of the wood on a site we are about to clear.
Integrating DSM Data into Estimating Software
Possessing high-quality 3D data is only half the battle; the “winning edge” comes from how that data interacts with your existing workflow. For a modern estimator, the Digital Surface Model must be interoperable with industry-standard tools to provide value.
CAD and BIM Integration
Raw DSM data (often in .TIF or .LAS formats) is imported into platforms like Autodesk Civil 3D or Revit. This allows estimators to overlay the proposed design directly onto the current surface model. By doing this, you can visually identify “clashes”, such as a proposed utility line running through an existing tree cluster or a concrete pad overlapping an unmapped utility vault.
Automated Quantity Takeoffs
Specialized estimating software can ingest the DSM to automate volume calculations. Instead of manually clicking points to define a stockpile, the software recognizes the 3D mass from the surface model and provides an instant cubic yardage count. This reduces human error and slashes the time spent on “Takeoff” tasks by nearly 70%.
The Digital Twin for Pre-Con
By merging the DSM with the project schedule (4D BIM), contractors can create a “Digital Twin” of the site. This allows teams to simulate different stages of site clearing and excavation. You can virtually “see” how the site changes week by week, ensuring that your bid accounts for the evolving logistics of a live construction environment.
Winning Edge for the Modern Estimator
In a business where profit is low, the firm with the best data usually wins. Adding high-end 3D maps to your bid is not just about being high-tech. It is about protecting your money and beating the competition. There are four main ways this tech changes the game for a person setting the price.
Big Risk Reduction
We get rid of the fear of site work. By seeing every obstacle in 3D, we do not have to add extra high costs for “just in case.” This makes our price look better to the client while still keeping the job safe.
Top Visual Proof
When a client asks why the cost to clear the land is high, we do not just tell them. We show them. A 3D model that shows 5,000 cubic yards of hidden junk is much more powerful than just a line on paper.
Speed of Work
In the world of RFPs, speed is life. Old ways of measuring take weeks. We can fly a drone and make a good map in hours. This gives us more time to find the best prices for parts and other workers.
Legal Safety
By following ASPRS Positional Accuracy Standards (2014/2023 Editions), we make sure all data is accurate and reliable. If there is ever a legal fight about “changed site conditions” or digging too much, our map acts as a real, professional record of how the site looked at the start.
Strengthening the Proposal Strategy
The main goal of using these top tools is to make a bid that is both low in price and safe. By following the AIA G201™–2013 rule for sending digital data, we make sure our info works with the architect’s BIM (Building Information Modeling) software. This creates a smooth flow of info from the first price to the final check.
Whether you are leveling a hill in the Western U.S. or working in the big cities, the 3D surface map gives the clear view you need. It turns a messy piece of land into a set of things we can predict. We always suggest using your air data along with a deep Geotechnical Report. This makes sure that while you have mapped the top with 99% accuracy, you also know exactly what is under the soil. This top-to-bottom way of looking at a site is what makes the top leaders better than all the rest.
Ready to Secure Your Next Project with Certainty?
We don’t just calculate bids; we provide transparent, visual, and highly accurate data to eliminate risk and keep your project on schedule. Let’s integrate precision 3D mapping into your next bid.
FAQs
How exact is the height in a professional building map?
For real work bids, we aim for Class 1 accuracy under the ASPRS rules. This means the height is usually correct within 5cm to 15cm. This is needed because even a small error on a large site can mean losing thousands of dollars in dirt volume.
Can a surface map help stop noise or dust?
Yes, by knowing the heights of walls and buildings, we can see how noise and dust move to nearby homes. This helps us bid better on sound walls or water trucks to keep dust down. These things are often required by city laws.
Does this tech take the place of a land surveyor?
No. Instead, it helps the surveyor. We use the surveyor’s ground marks to anchor our digital maps. The mix of old survey care and the high amount of drone data gives us the fullest picture of the land possible.
How does a surface map make crane work safer?
A 3D map finds the exact height of power lines and nearby buildings. We use this for Clash Detection to test the crane’s swing path. This makes sure it will not hit any objects. This is a key safety step for any city project.
Can you make a map using satellite photos?
You can get a rough map from space, but it is too blurry for a real building bid. Satellite data usually sees things at 30cm to 1 meter. Drone or air LiDAR sees things at 1cm to 5cm. This is the top standard for winning bids.